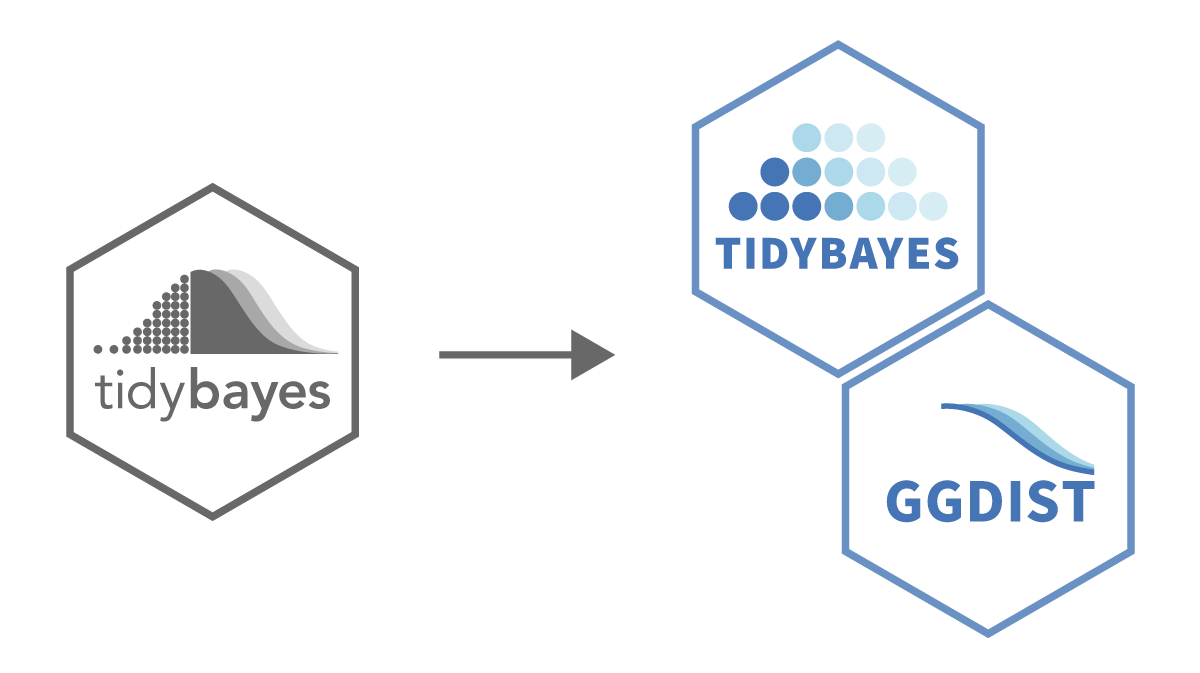
Tidybayes 2.1 is a minor—but exciting—update to tidybayes. The main changes are:
I have split
tidybayesinto two packages: tidybayes and ggdist;All geoms and stats now support automatic orientation detection; and
Lineribbons can now plot step functions.
More details on these changes (and some other minor changes) below.
Tidybayes is now tidybayes + ggdist

tidybayes began as a package focused on munging posteriors from Bayesian models into a format suitable
for use with ggplot2. Over time, it grew an additional tree of
functionality: a pantheon of geoms and stats designed for creating uncertainty visualizations.
The inclusion of this uncertainty visualization functionality in a package ostensibly focused on
munging Bayesian posteriors has become increasingly awkward, especially with the addition of the
stat_dist_ family for
visualizing analytical distributions and the
frequentist uncertainty visualization vignette
it enables. So I decided to spin off the geoms and stats from tidybayes into a new package, ggdist, with
fewer dependencies and without the word “Bayes” in its name. I hope this brings the
slab+interval and lineribbon
families of geoms to a larger audience, increasing the spread of modern uncertainty visualization techniques:

For existing tidybayes users, this change should not affect your workflow: you can keep using
all the familiar tidybayes geoms and stats directly from tidybayes itself. Currently (and for
the foreseeable future), tidybayes will re-export all geoms and stats from ggdist. This is
because, besides the fact that I don’t want to break existing code, these functions form
a core part of the tidybayes workflow. So you can continue as before and ignore the existence
of ggdist if you like! Meanwhile, I hope new folks will find ggdist useful with its slimmer
dependencies and a focus just on visualization.
Automatic orientation detection for all geoms and stats
All geoms and stats in tidybayes (well, ggdist) now automatically detect their orientation based on
aesthetic mappings, making the h-suffixed geoms obsolete. This change is enabled by the
new orientation-detection code in ggplot2 itself, written by the inimitable
Thomas Lin Pedersen.
You can see automatic orientation detection in action below:
library(ggplot2)
library(ggdist)
library(patchwork)

set.seed(1234)
df = data.frame(var = c("a", "b"), value = rnorm(2000, c(1,3)))

horizontal_plot = ggplot(df) +
  stat_halfeye(aes(x = var, y = value)) +
  ggtitle("stat_halfeye(aes(x = var, y = value))") +
  theme_ggdist()

vertical_plot = ggplot(df) +
  stat_halfeye(aes(x = value, y = var)) +
  ggtitle("stat_halfeye(aes(x = value, y = var))") +
  theme_ggdist()

horizontal_plot + vertical_plot
The main implication for existing users is that if you are using horizontally-oriented geoms
(like the ever-popular stat_halfeyeh()), you can (in 99% of cases) simply delete that ugly trailing
h from the function name and the same plot should be output. If you don’t, it should still work, but you will
get a deprecation warning.
More notes on orientation detection:
- All
h-suffix geoms are now deprecated. Theh-suffix geoms have been left intidybayesand give a deprecation warning when used; they cannot be used fromggdistdirectly. - If the orientation detection fails, you can always specify the correct orientation manually using
orientation = "horizontal"ororientation = "vertical". The alternate spellings (used by base ggplot2)orientation = "y"andorientation = "x"also work; I prefer the horizontal/vertical nomenclature because (1) x and y are axes, not orientations, (2) I find it easier to remember which is which with horizontal/vertical, and (3) I already implemented theorientationparameter using those names in a previous release (before automatic orientation detection was a thing :) ). - The
h-suffixpoint_interval()functions are also deprecated, since they are no longer needed intidybayesnor inggplot2::stat_summary(). geom_interval(),geom_pointinterval(), andgeom_lineribbon()no longer automatically set theyminandymaxaesthetics if.loweror.upperare present in the data. This allows them to work better with automatic orientation detection (and was a bad feature to have existed in the first place anyway). The deprecatedtidybayes::geom_intervalh()andtidybayes::geom_pointintervalh()still automatically set those aesthetics, since they are deprecated anyway (so supporting the old behavior is fine in these functions).
Stepped lineribbons
Solomon Kurz requested stepped lineribbons, which are
useful for visualizing survival curves, amongst other things.
You can now use the step argument of lineribbon geoms and stats (points shown for reference)
to construct stepped lineribbons:
library(ggplot2)
library(ggdist)
library(patchwork)

stepped_plot = function(step, step_text = deparse(step)) {
  ggplot(data.frame(x = 1:5), aes(x = x)) +
    stat_dist_lineribbon(aes(dist = "norm", arg1 = x), step = step) +
    geom_point(aes(y = x), size = 3) +
    ggtitle(paste0("step = ", step_text)) +
    theme_ggdist() +
    guides(fill = FALSE)
}

stepped_plot(step = FALSE, "FALSE (the default)") +
  stepped_plot(step = TRUE, 'TRUE (or "mid")') +
  stepped_plot(step = "hv") +
  stepped_plot(step = "vh")
## Warning: `guides(<scale> = FALSE)` is deprecated. Please use `guides(<scale> =
## "none")` instead.
## Warning: `guides(<scale> = FALSE)` is deprecated. Please use `guides(<scale> =
## "none")` instead.
## Warning: `guides(<scale> = FALSE)` is deprecated. Please use `guides(<scale> =
## "none")` instead.
## Warning: `guides(<scale> = FALSE)` is deprecated. Please use `guides(<scale> =
## "none")` instead.
Minor changes
ggdistnow has its own implementation of the scaled and shifted Student’s t distribution (dstudent_t(),qstudent_t(), etc), since it is very useful for visualizing confidence distributions. These functions are re-exported intidybayesas well.- All deprecated functions and geoms now throw deprecation warnings (previously, several deprecated functions did not).